


Local Service Ads (LSAs) have emerged as a powerful tool for businesses aiming to connect with local customers. These ads, prominently displayed in Google search results, offer a streamlined way for service providers to showcase their offerings, contact information, and customer reviews. While LSAs have proven instrumental in enhancing local visibility, the challenge arises when managing and reporting on them at scale, particularly for businesses with multiple locations.
The intricacies of overseeing numerous service areas, diverse offerings, and individualized performance metrics pose a formidable hurdle for advertisers seeking comprehensive insights. In this article, we delve into the complexities of scaling Local Service Ad reporting in Looker Studio, and outline our approach to getting LSA KPI’s into looker studio reports.
Getting LSA data into Looker Studio: How we got here – an introduction
Getting local services ads information into looker studio reports is surprisingly difficult. As of now, there does not to be a native connector for this, and a few paid services exist, but they are expensive and only give basic data on single accounts.
It gets expensive to use connector services: Of the connectors that can pull LSA data into looker studio, we found billing often racks up quickly when a large number of locations are involved. We priced it out for our client list and it just didn’t make sense from a cost standpoint.
We wanted to create something that was inexpensive to run, offered a greater level of functionality for multi-location businesses, and could run on a single looker studio document for all clients. It needed to scale across our entire LSA client base of 200+ individual LSA campaigns. Ideally we wanted a single looker studio document that could be permission bound for individual locations, or opened up to the entire system for corporate staff and our internal marketing agency account managers.
We ended up finding a way to meet all our requirement goals, and costs very little (sometimes pennies a month).
Clients initial opinions of Local Service Ads:
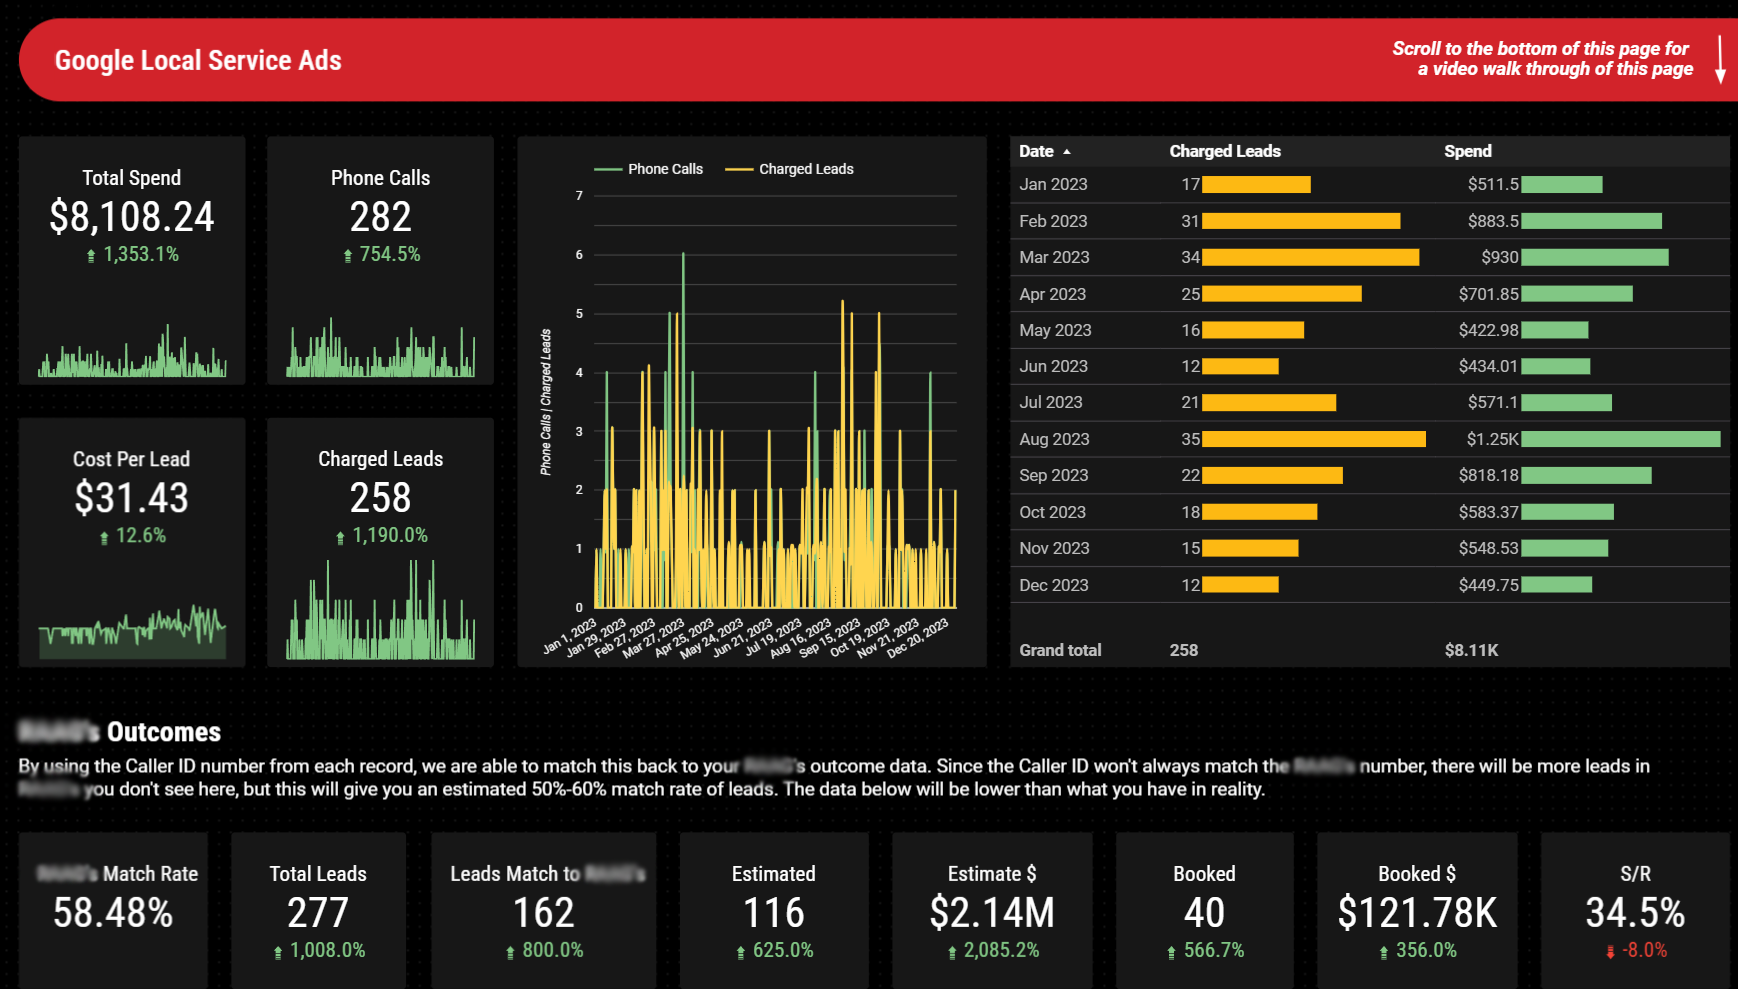
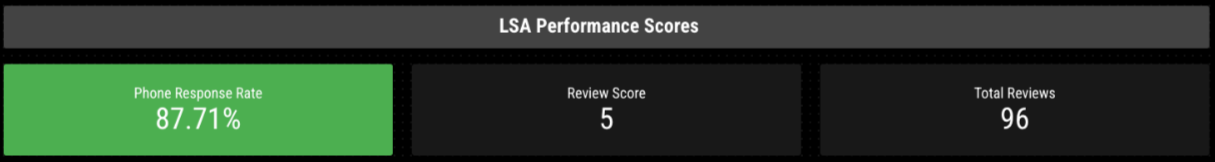
In interacting with many clients utilizing LSA – we have found it is not uncommon for business managers to initially interpret LSA ads as a lower quality lead source with questionable ROI, in our measurement of LSA campaigns, we found this negative sentiment to not hold true.
We wanted to make a way to make it very easy to understand LSA performance and ROI for a multi-location home services business with over 400 total locations. Getting all owners on board to track these calls, mark them in their CRM properly proved to be difficult to do at scale and with consistency. Even getting everyone to agree to run LSA took some proving. We needed hard evidence to show this was a good business decision, and to do that well we knew some tracking automations would be needed.
To solve for this we set up an automated process to better measure and report on outcomes from LSA activity.
How our LSA to Looker Studio reporting solution works:
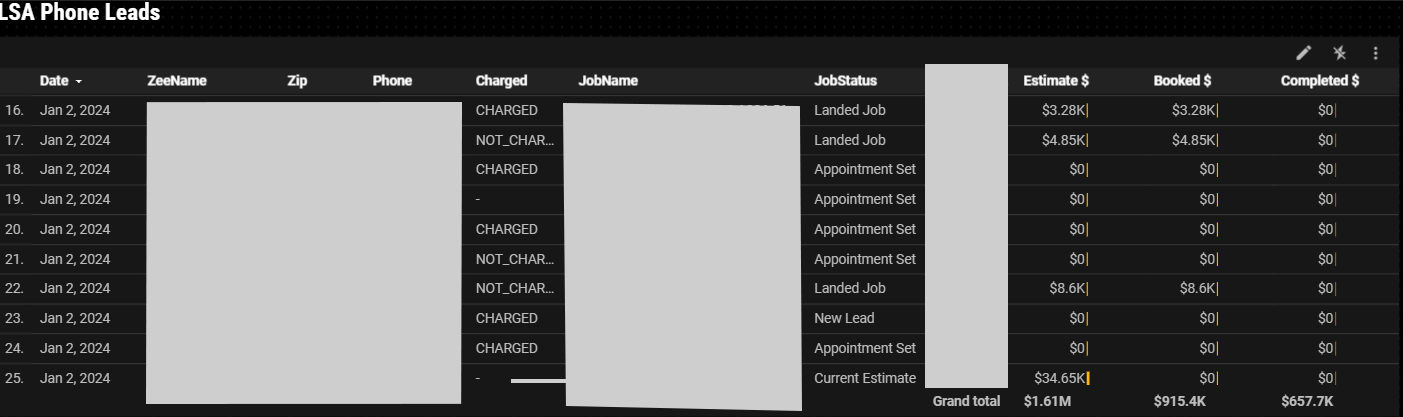
Phone numbers that called the ad (found via the LSA API) are cross-referenced in the customer CRM. From here we can follow the sales process from the LSA call and determine if the job estimated, and if the job ended up booking after that estimate. This is a ‘caller id lookup’ that works alongside CRM tracking number tagging.
How this works on a technical level (for you) would depend on your ability to reference customer records, the exact process will vary in almost every business scenario and a solution would need to be evaluated. None the less – this article dives into some of the inner workings of how this solution works for one of our multi-location clients.
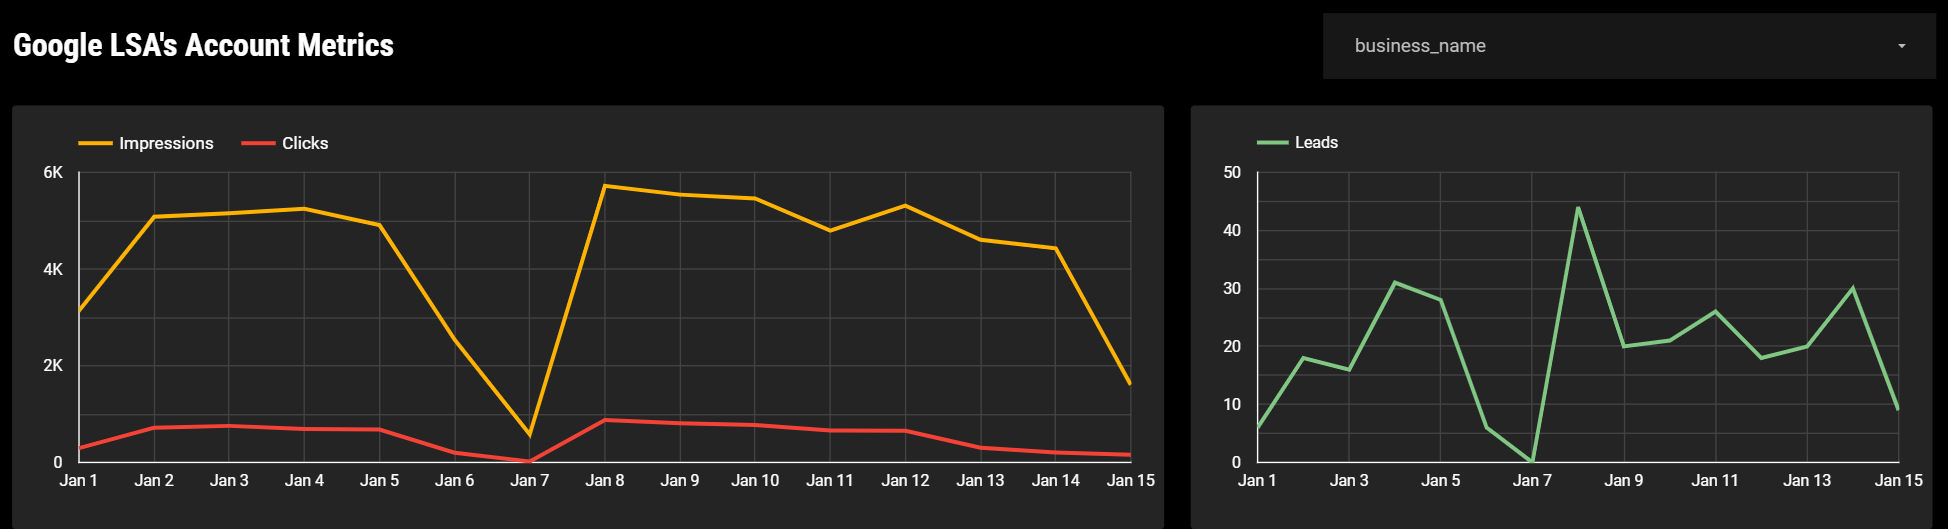
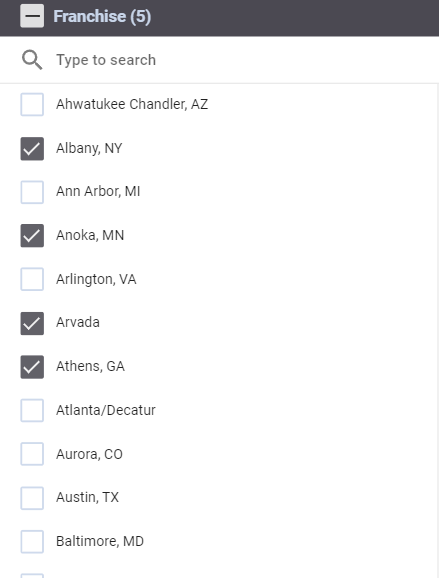
LSA Reporting on multiple locations within a larger brand
Multiple location businesses need ways to slice and dice location data within reporting systems. Weather it be a single location report for a location general manager, a set of locations for a regional manager, or aggregated metrics for all locations as a whole, this is a solution that allows for a single looker studio document to cover all bases.
Fields Available For Reports
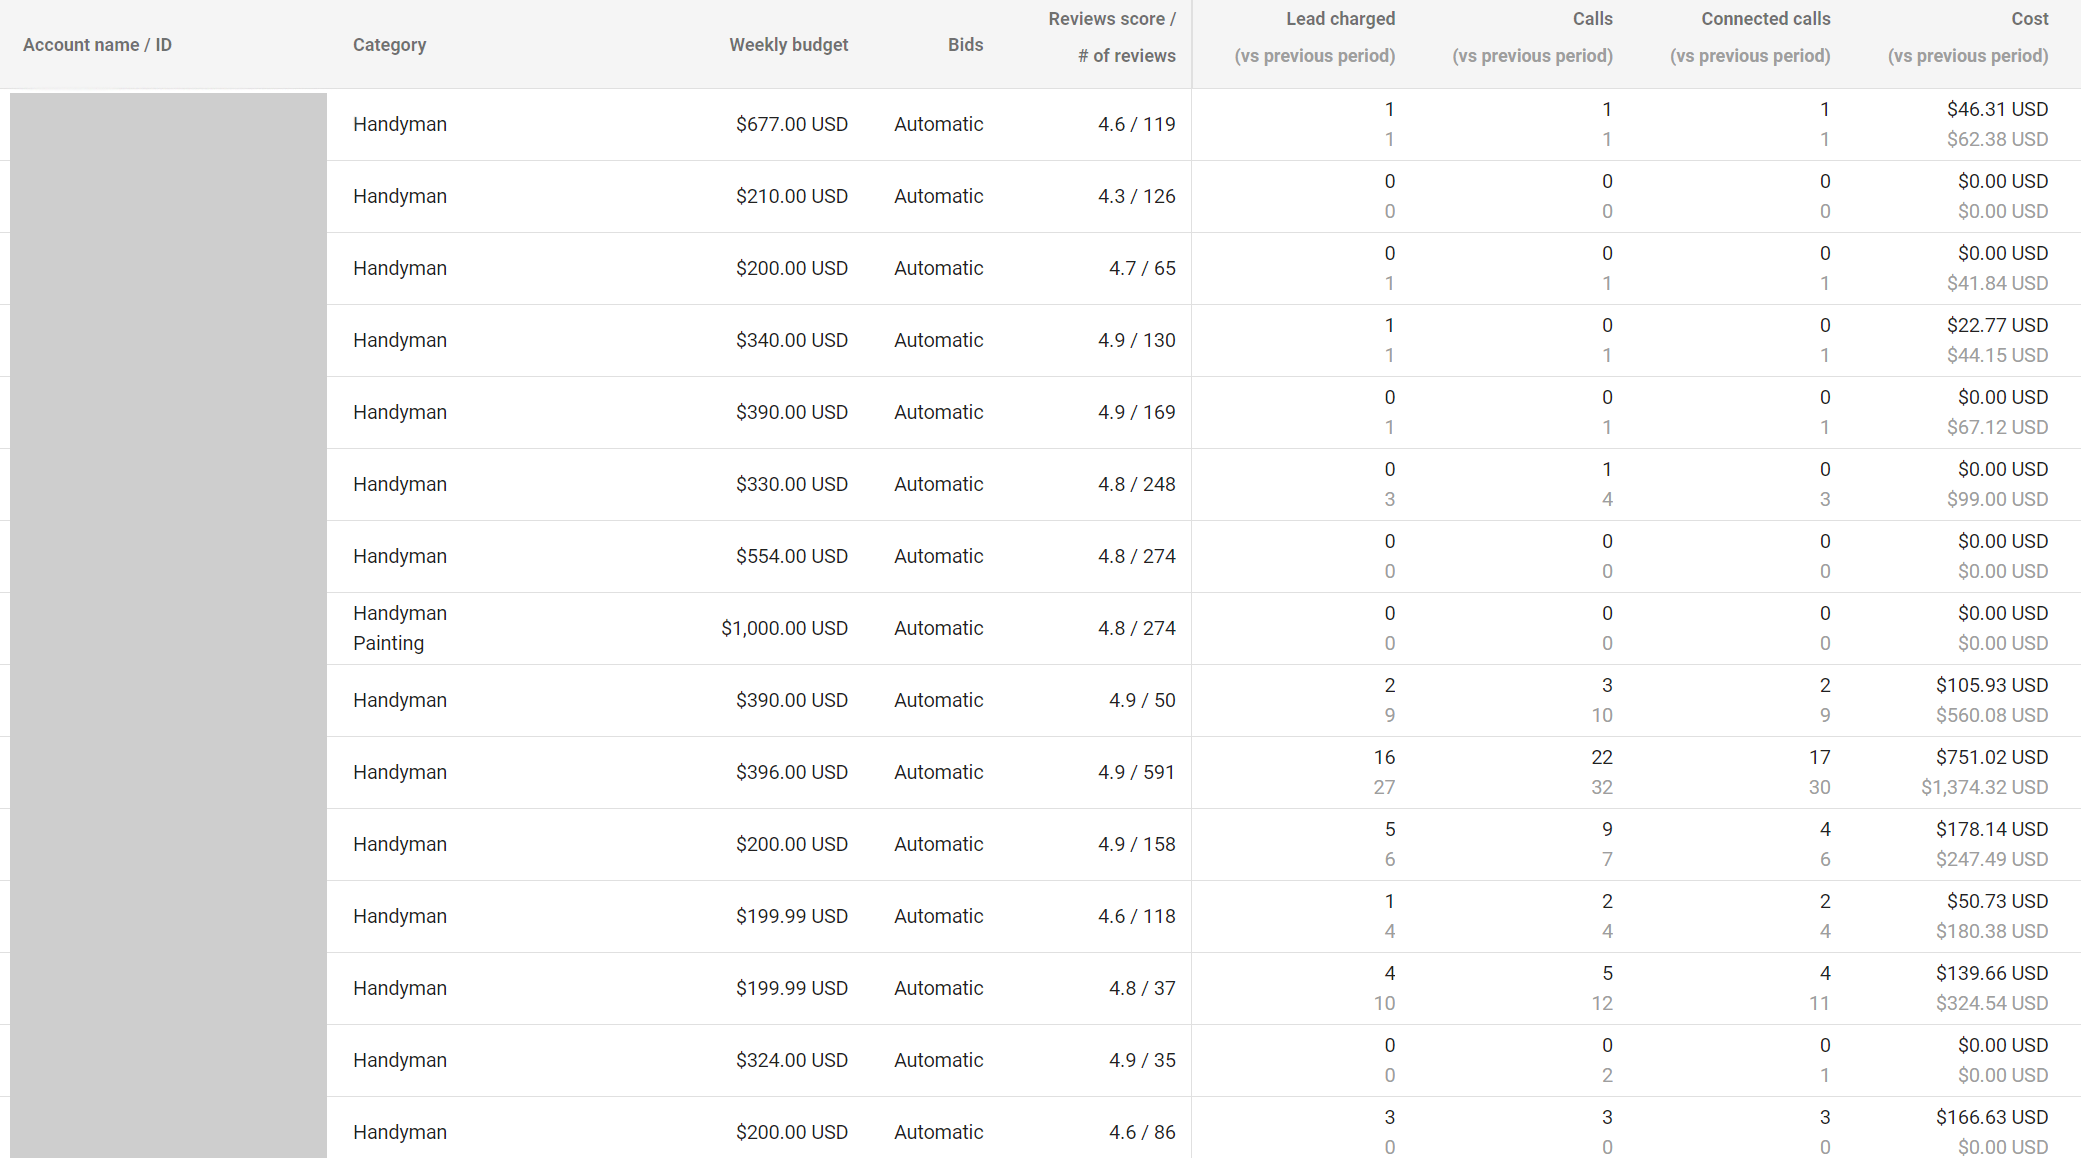
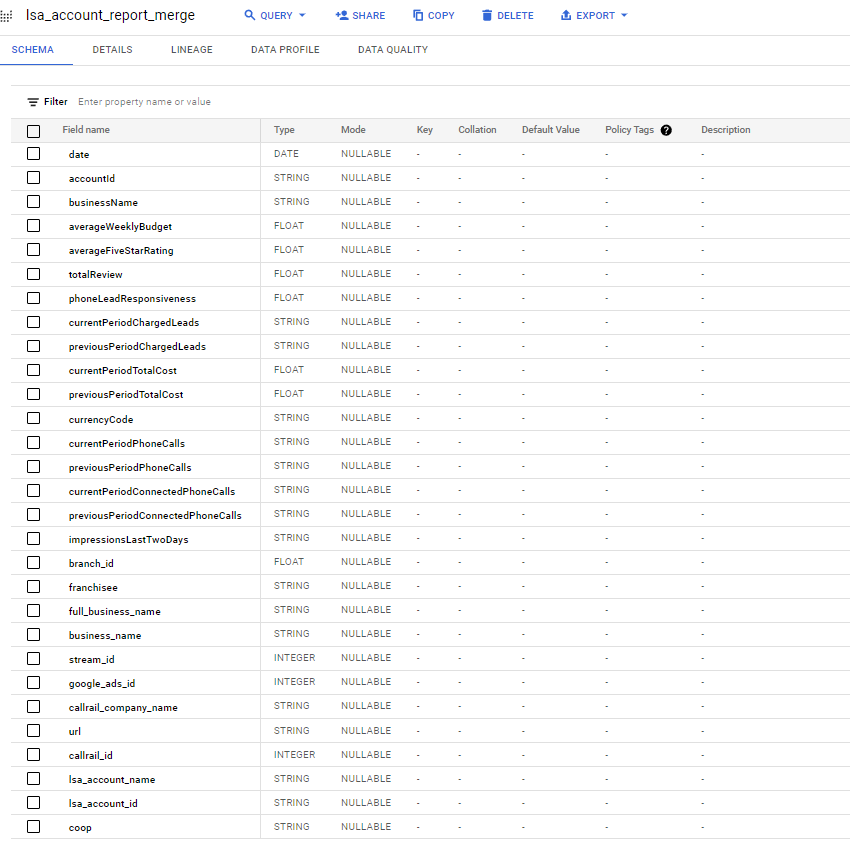
The LSA API offers a few fields for looker studio reports that are not available in Google’s LSA reports section. From the AccountReports fields:
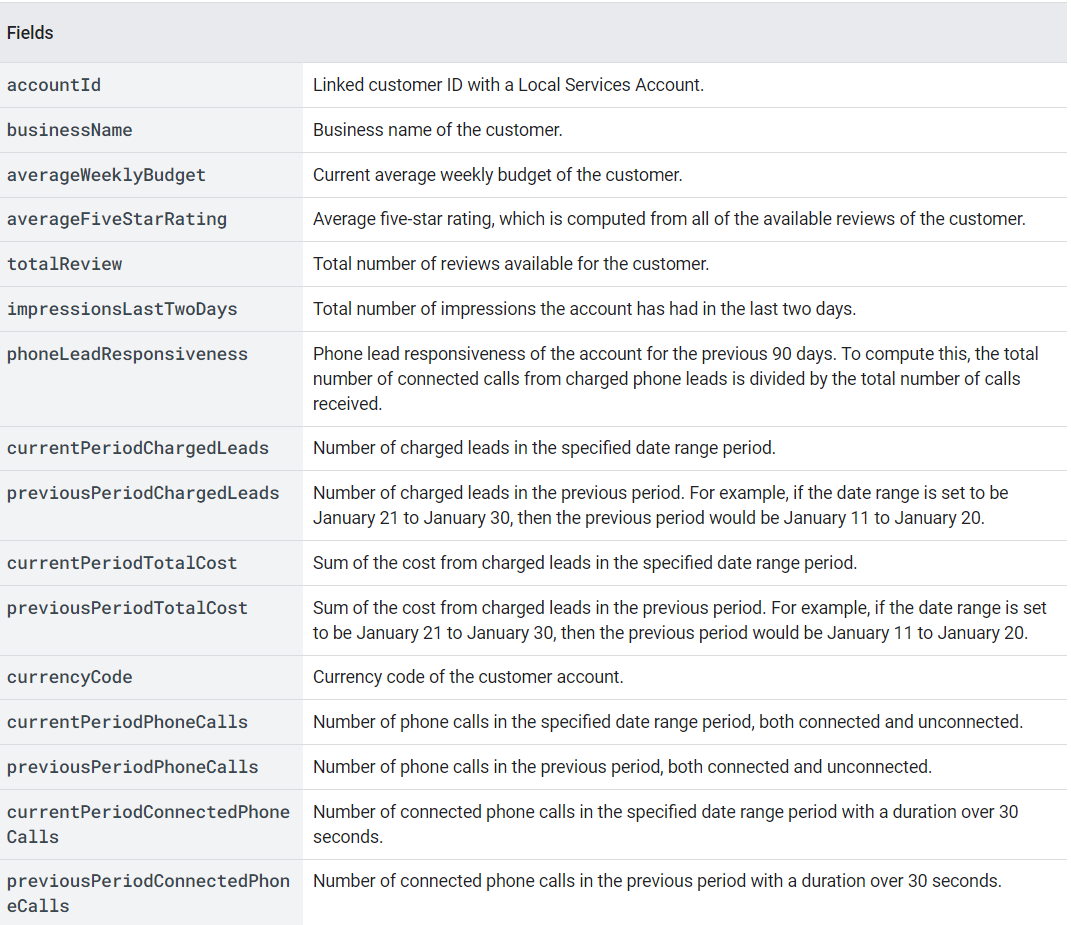
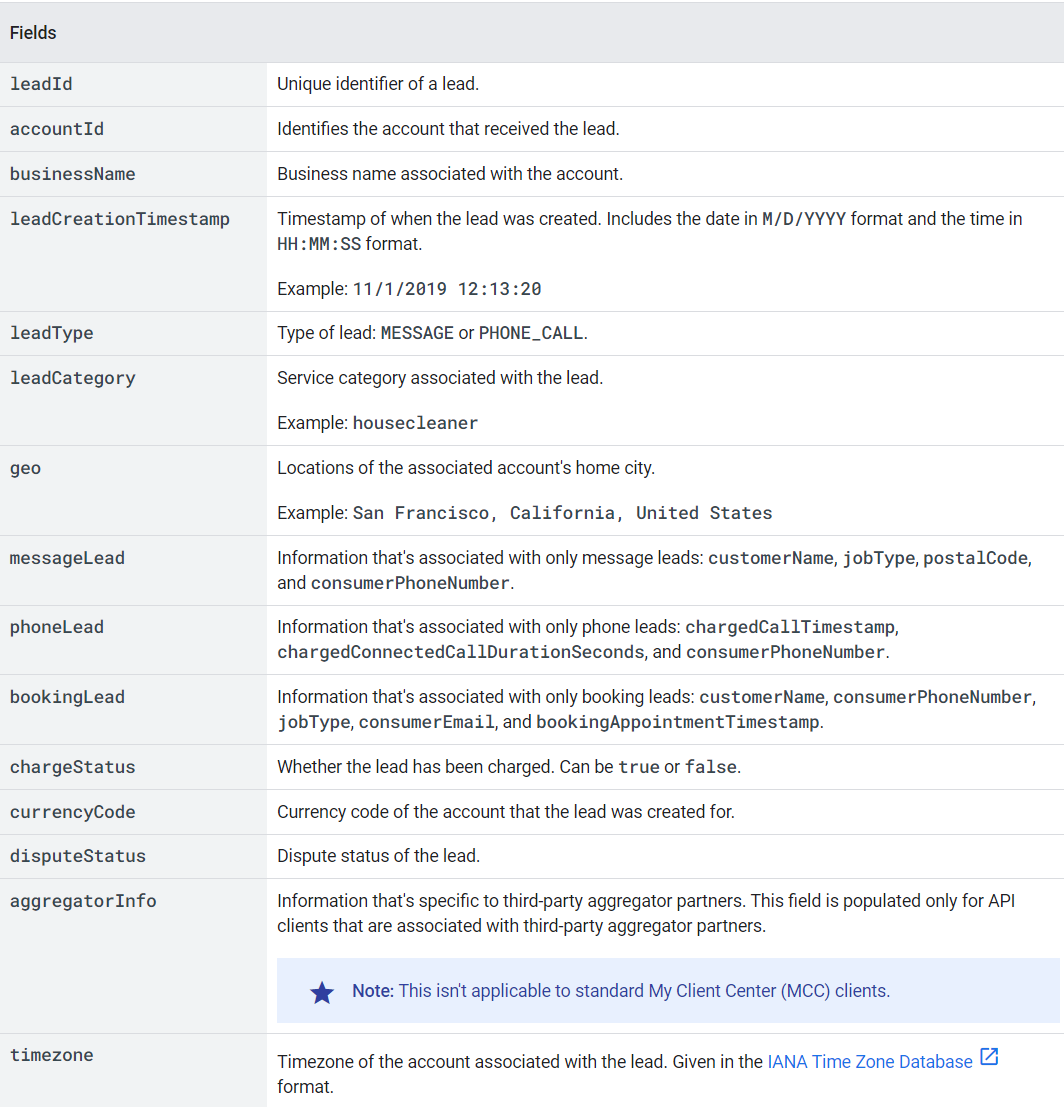
The DetailedLeadReports Feed logs each individual lead that comes in from LSA campaigns. This is used to get counts on leads, charges leads, location of leads, and the type of lead (message or phone):
The technical details
Building a system like this requires understanding programming around API’s , BigQuery Database management (or some other relational database), and advanced set up for Looker Studio reports. If you have developers on staff, or work with a digital agency (like us!) its possible to build this for your organization. If you need help, submit our project request form so we can learn more about what would be required for your organization to build something similar.
Prerequisites:
- Understanding of programming around Google API’s or using API connectors
- Understanding of BigQuery Databases, and database views
- Understanding of Looker Studio reporting, particularly in configuring to pull data from BigQuery views
Setting up data storage & logging
After some exploration, we settled on utilizing LSA API’s to fetch and store LSA report data into a BigQuery database. BigQuery allows the dataset to get very large over time and still have snappy retrieval even when filtering and joining up against other data sets.
Data is stored across 2 tables, one table to log information from the accountReports API endpoint, and another that logs data from the leads endpoint. Within our set up, the data is fetched via a node.js application configured to run daily on a cron schedule, and the previous days data is saved to BigQuery via this process. Each morning the previous days calls and account information log to the database.
Why bother saving API output to bigquery when you can get it right from the api? – We do this so we can more easily join up data sets from customer CRM systems, and get much faster query and report load times when selecting large data sets.
To start, your going to want to make sure you have a BigQuery database set up and know its connection information.
Our structure ends up looking like this:
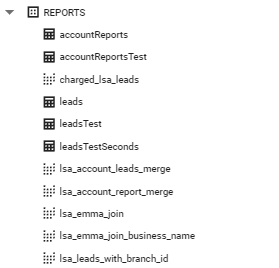
Because joins via views can be used to separate locations, regions, or even entirely separate clients, all LSA data can log to these 2 tables, separate instances for groups are not needed unless there are specific storage requirements from the client.
The Node.js Application
From here your going to need to set up oath permissions to BigQuery to use in your code later. Our implementation uses a node.js application that runs on a daily cron to fetch the previous days data each morning. The actual code here is fairly straightforward – you grab data from the LSA api for the previous day each morning, and save that output to a database. One important piece of the set up here is that the LSA profiles all live under one master account – this saves needed to loop through multiple LSA id’s and hit the api for each location. You don’t have to use node for this – its doable in just about any language, its just what we chose to use for the project.
Structure of the LSA account

Setting up the Looker Studio Report
We build most of our looker reports from scratch to get the look and feel exactly how we want it. You probably wont be able to find a clean ‘out of the box’ template for this type of solution and will need to assemble the report manually in the Looker Studio report editor.
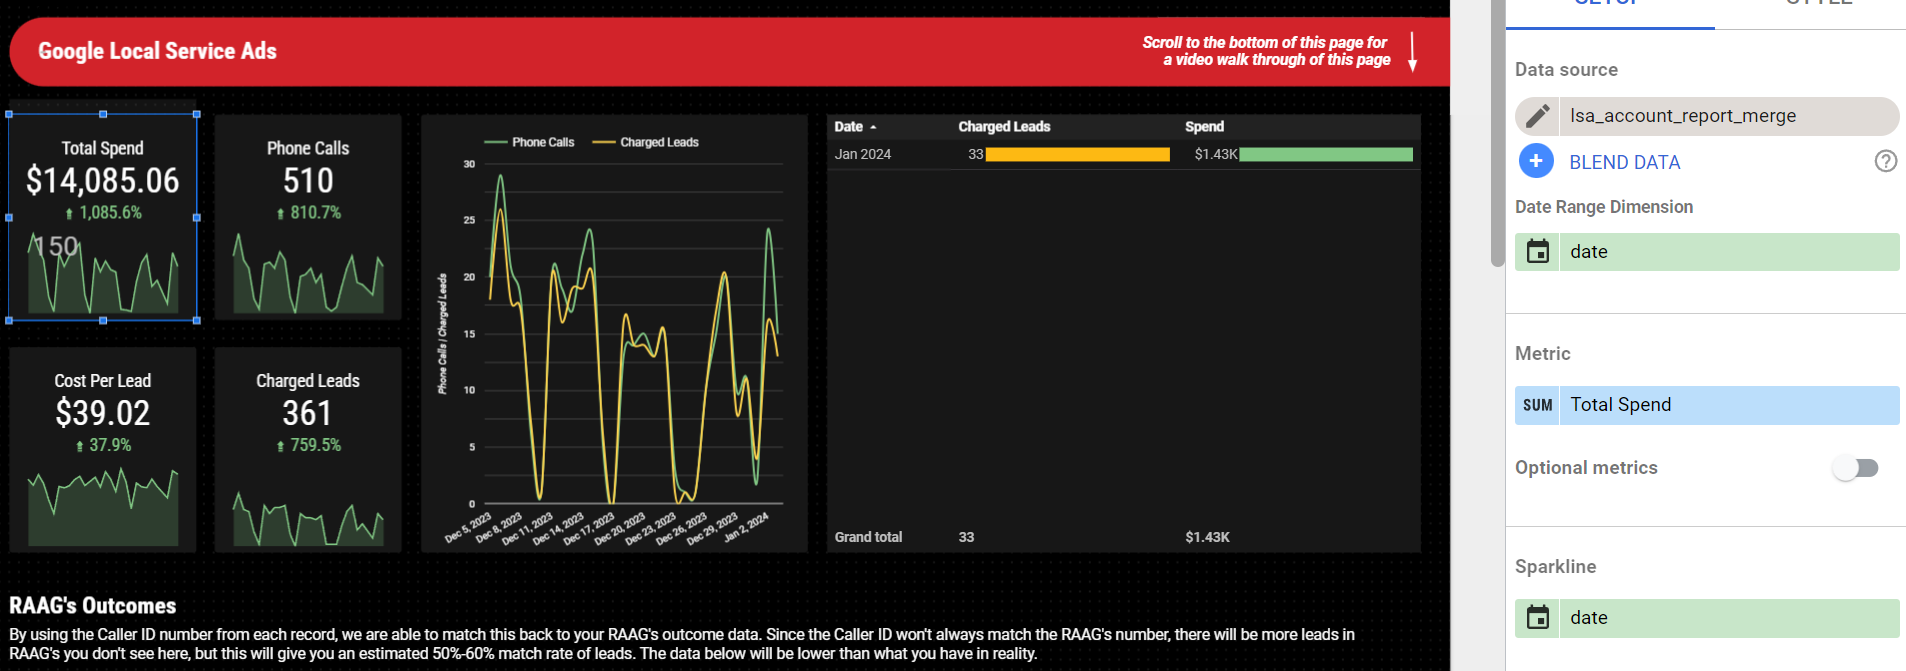
Each portion of the report continues to utilize views that join up LSA data with customer information or CRM tables.
Conclusion:
LSA reporting for multi-location business’s in looker studio can be expensive to produce when using paid connector services. By building your own Looker Studio data source solution, reporting can be enhanced and run very inexpensively. An upfront build out is required, its technical and might take some time to test and build properly, however over time we think the up front investment is worth it for large operations that are purchasing local service leads from Google.
Custom LSA to looker studio functionality can be built by using Google APIs and relational databases. Storing and joining the data to CRM records also becomes possible and adds a powerful layer of intelligence to the reporting that exceeds that of the naive LSA reporting features.
If you are looking for help with a LSA reporting solution, especially for a multi-location operation or digital marketing agency. Contact us if you would like us to quote you on building you a similar solution.